Research report

Social Creative Insights

The cumulation of over 2 years of R&D work, this report measures which creative choices drive engagement on Instagram, TikTok, YouTube, Facebook & Pinterest. Every finding comes with statistically significant insights based on real brand social performance data.

Get the full report

Report preview

#4 Invest in Premium Professional video over middle-ground Standard Professional

77% of social videos are either Premium Professional or social-native style. The trap is the middle ground: Standard Professional video, polished but not distinctive, lands about 10 spots lower than the rest. Commit to high craft or social-native, rather than splitting the difference.

10

spots higher

Premium Professionalspot 55 of 100
Standard Professionalspot 45 of 100
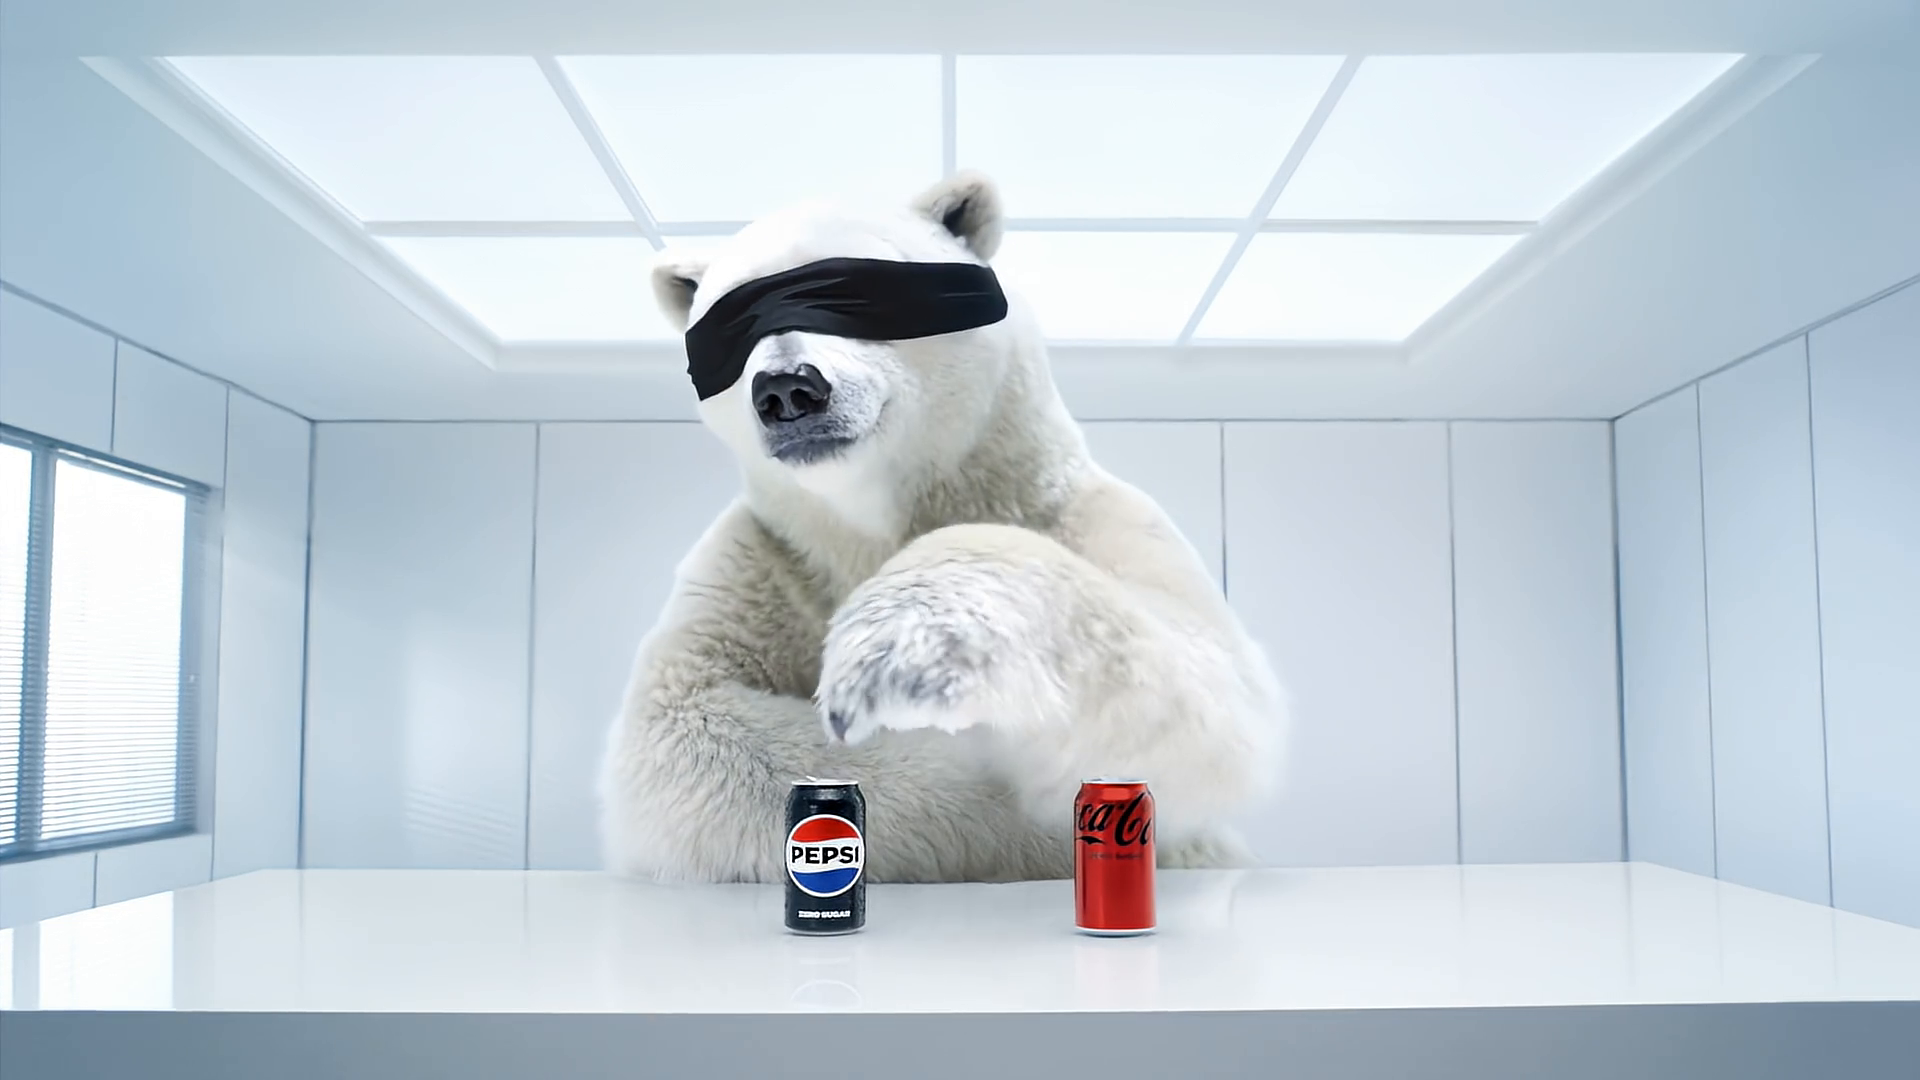
  • YouTube ShortsFollows rule
    Pepsi

    The Choice | Pepsi | Super Bowl

    Top 7% of Pepsi's posts by views

  • YouTubeFollows rule
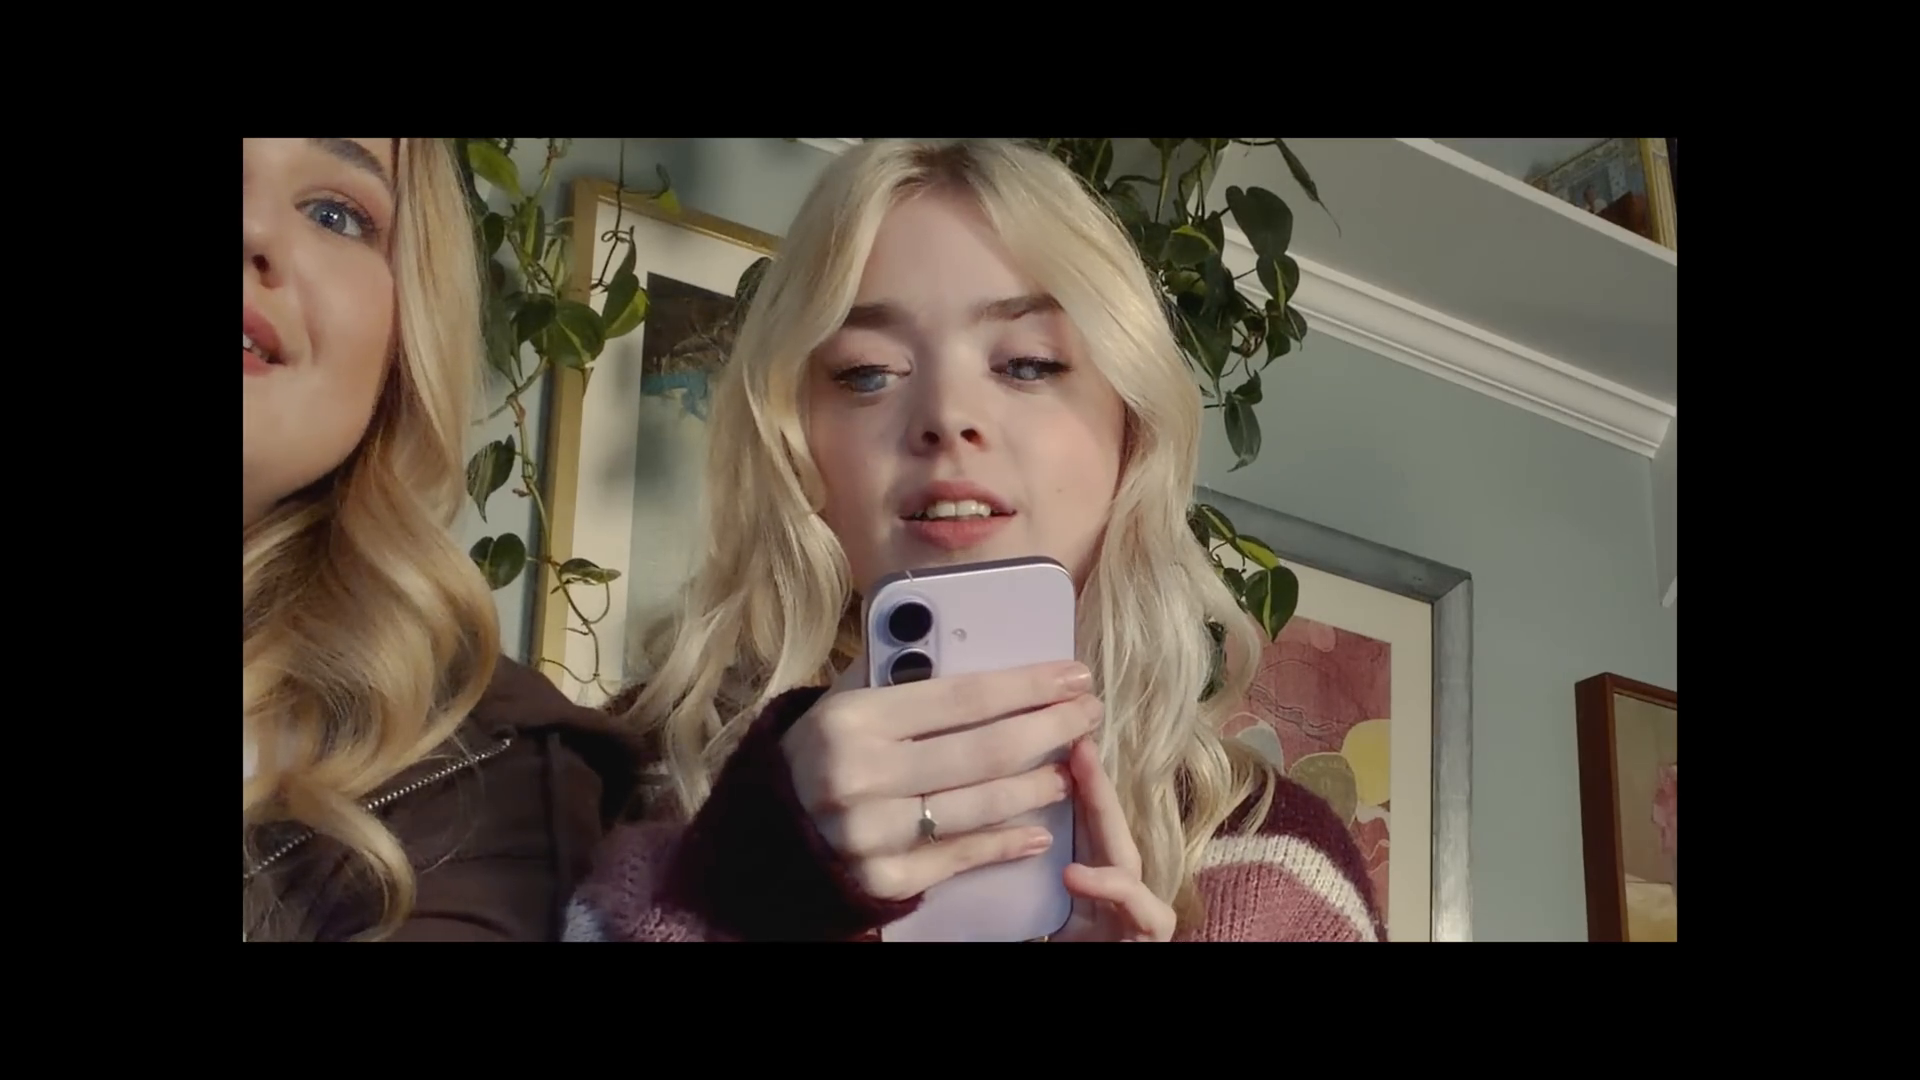
    Apple

    Accessibility | I’m Not Remarkable | Apple

    Top 5% of Apple's posts by views

  • TikTokFollows rule
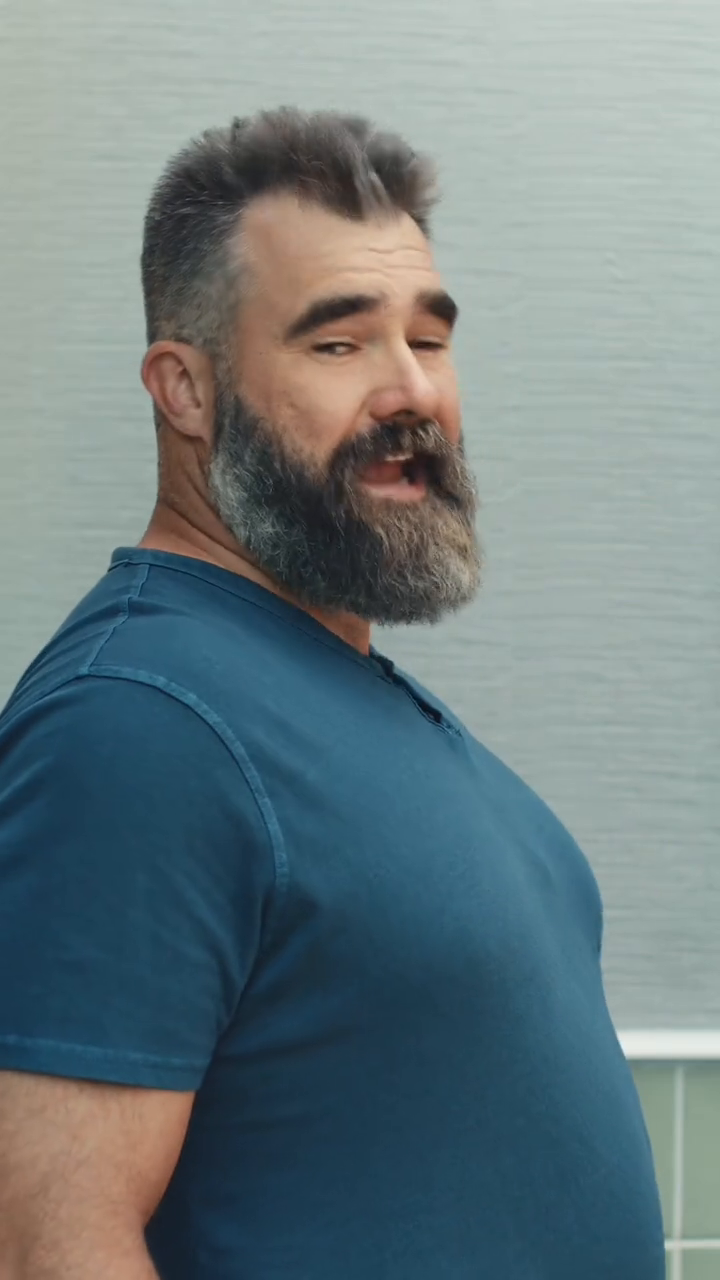
    Liquid Death

    We want your pee. Please give us your pee. And mailing your pee to AI data centers has never been easier with our…

    Top 5% of Liquid Death's posts by views

  • YouTube ShortsBreaks rule
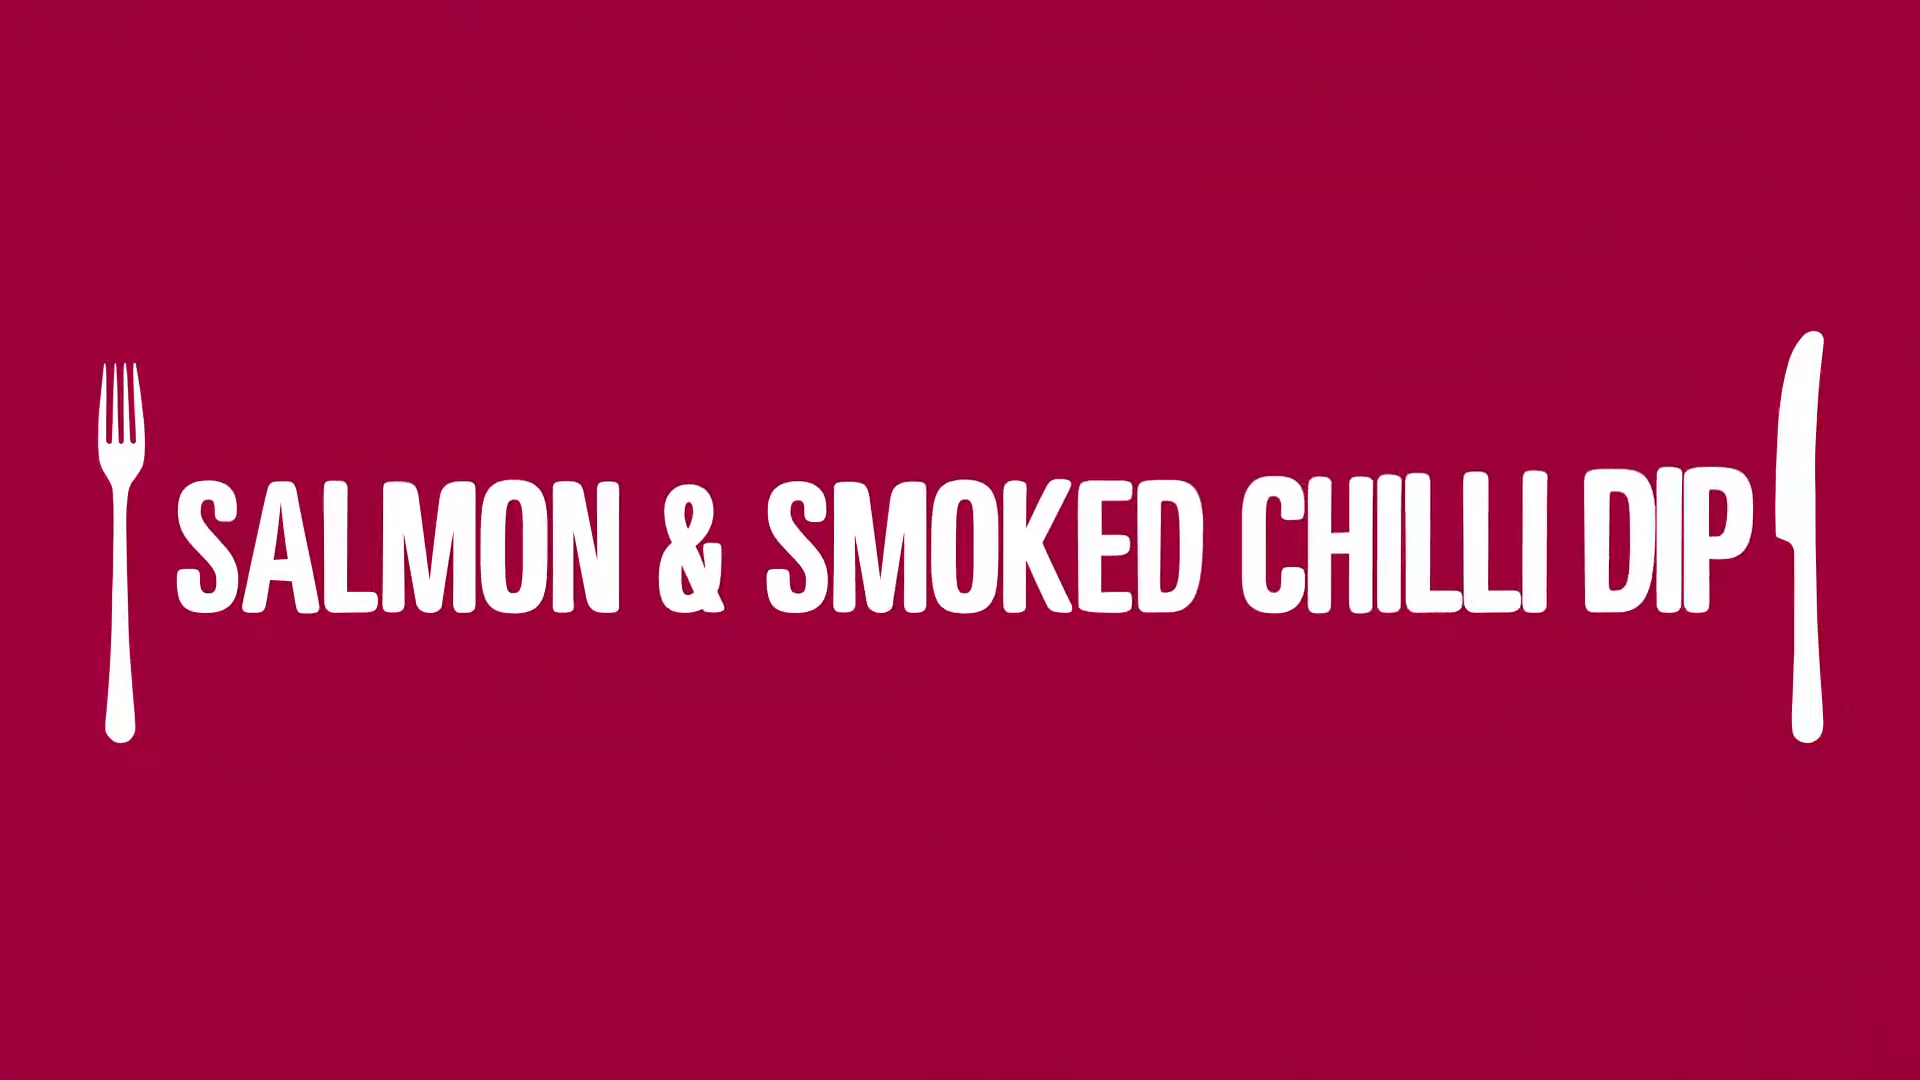
    Nairn's

    Salmon & Smoked Chilli Dip

    Bottom 5% of Nairn's posts by views

  • YouTubeBreaks rule
    Aon

    US Hurricane Automated Event Response: Real-Time Loss Insights for Better Decisions

    Bottom 5% of Aon's posts by views

Report includes access to full analytical breakdowns of 189 assets from top brands like these...

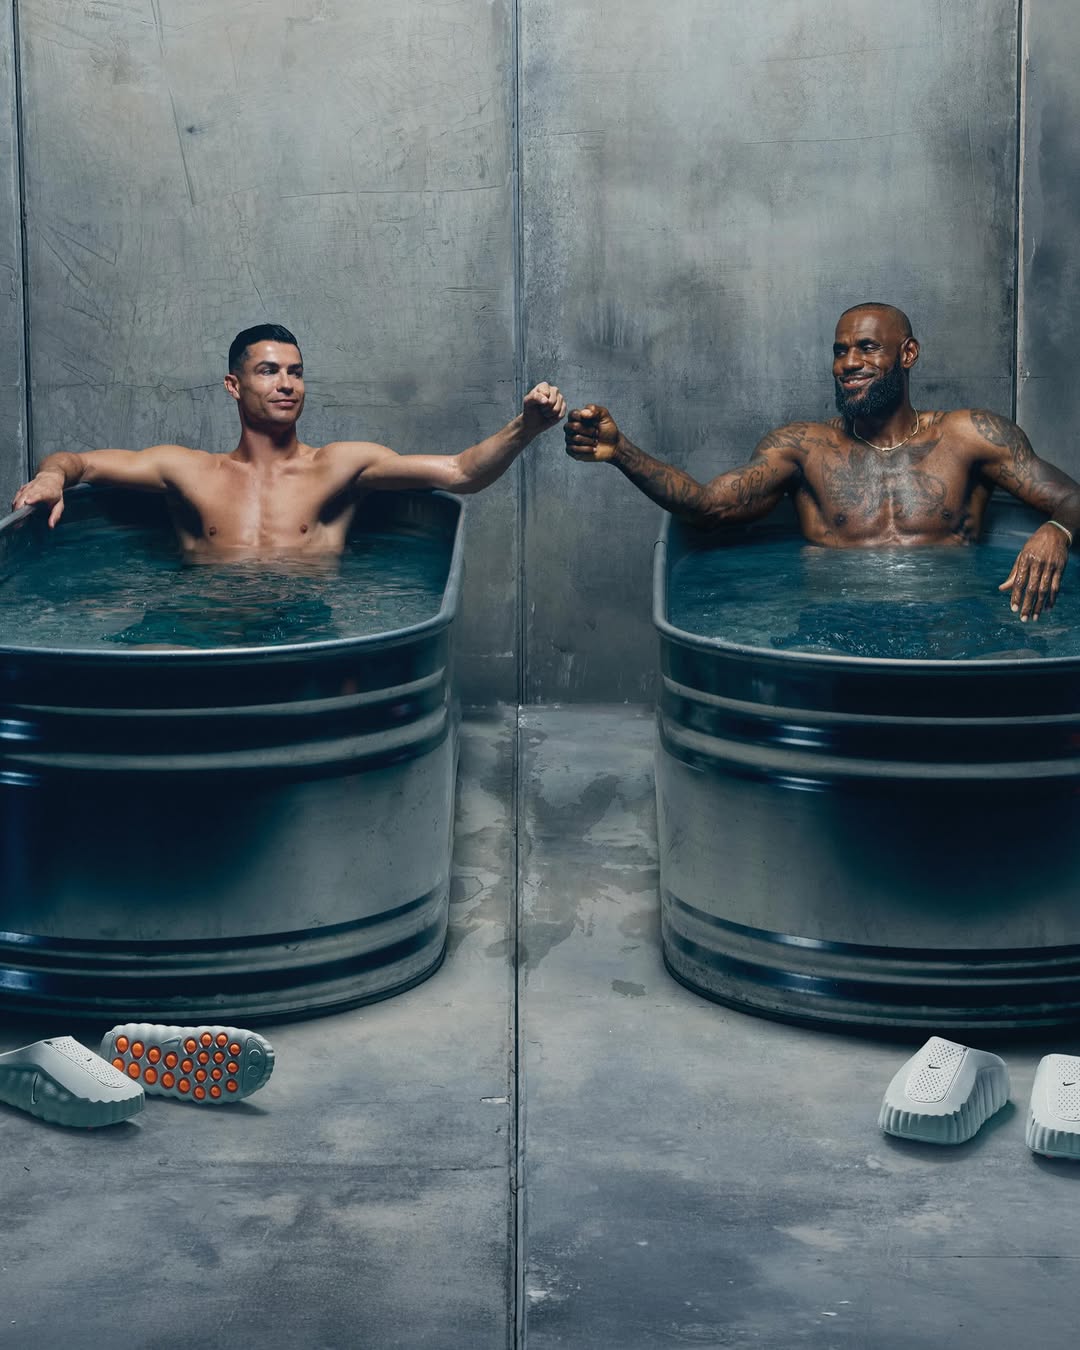
  • Instagram
    Nike
  • TikTok
    Alo Yoga
  • Instagram
    Levi's
  • YouTube
    Chamberlain Coffee

Get the full report